


07 November 2017Business Breakfast held in Derby by D2N2
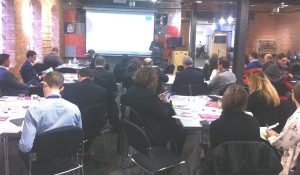
Businesses heard about HS2 plans for Nottinghamshire and Derbyshire, and their role in ‘refreshing’ the economic strategy for the area, at the third of the D2N2 Local Enterprise Partnership’s Business Breakfasts series today (November 7).
Each year D2N2 – the private sector-led partnership of business, local authorities, skills and training providers, community and voluntary services, and others promoting economic and jobs growth across Derby, Derbyshire, Nottingham and Nottinghamshire – hosts free Business Breakfasts across its area. The events are a chance to consult businesses on future LEP plans and tell them about recent successes.
This morning’s event – the third of six Business Breakfasts – was held at the Derby Silk Mill, Derby city-centre.
Around 40 delegates heard from speakers:
D2N2 Chief Executive David Ralph. He spoke about recent D2N2 projects and its ambitions to use a proposed HS2 high speed network line through its area to promote economic growth, as well as greater transport connectivity.
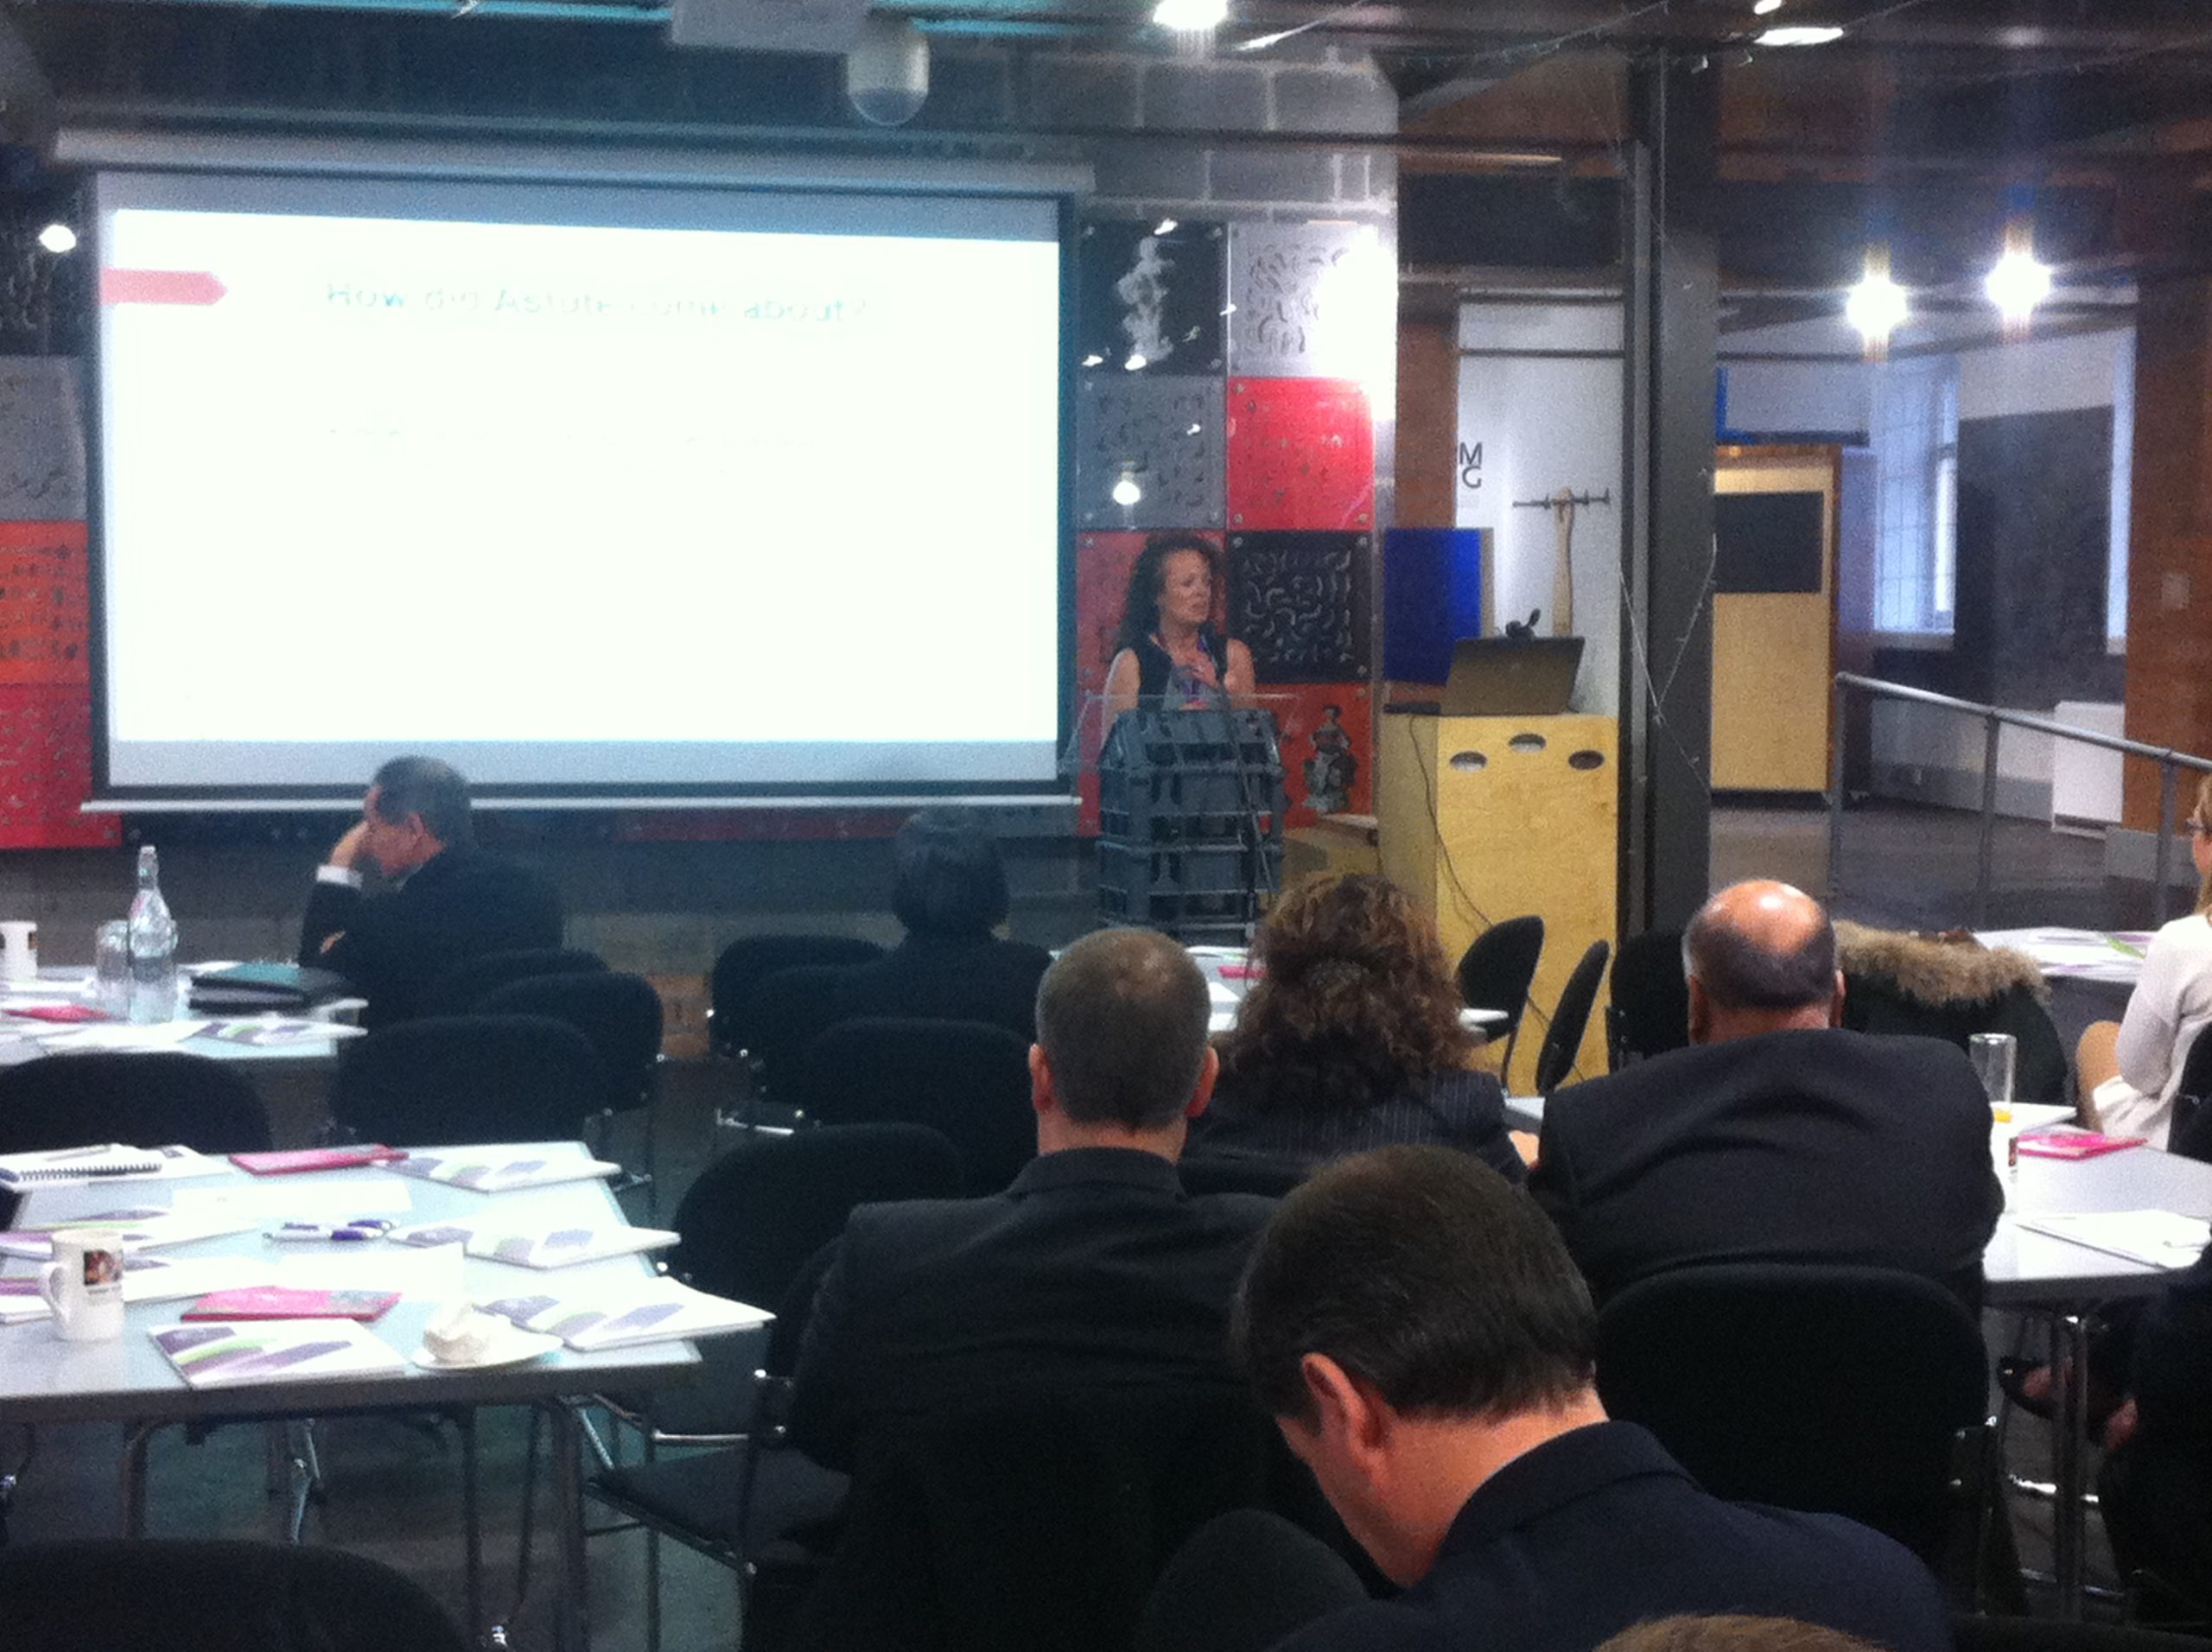
Guest business speaker Mary Maguire (PICTURED BELOW), co-founder and joint Managing Director of Astute Financial Recruitment (which has offices in Derby and Nottingham), about how she set up her award-winning business and her aspirations for it.
Richard Kirkland, European Structural and Investment Funds (ESIF) Officer for D2N2, on the use being made of ESIF funding from the European Union – via D2N2 – to aid the LEP area economy. Richard also spoke about D2N2’s consultation with businesses, local authorities and others on the LEP’s ‘refresh’ of its Strategic Economic Plan; the current masterplan by which it pursues over-arching ambitions such as creating 55,000 jobs by 2023 (the majority to be in the private sector).

Tickets are still available for the three remaining D2N2 Business Breakfasts, to be held across the LEP’s area at different locations in November. Places can be booked online via the D2N2 website Events page at www.d2n2lep.org/Events . Future Business Breakfasts’ details are:
Tuesday November 14 – Buxton Pump Rooms, The Crescent, Buxton.
Guest speakers – James Berresford, Chair of the Buxton Crescent and Thermal Spa Heritage Trust; and University of Derby Vice-Chancellor Professor Kathryn Mitchell.
Tuesday November 21 – The Best Western Lion Hotel, 112 – 114 Bridge Street, Worksop.
Guest business speaker – Claire Monk, General Manager and Brewer of Welbeck Abbey Brewery.
Tuesday November 28 – The Pavilion Room, The Derbyshire Hotel, Carter Lane East, South Normanton.
Guest business speaker – Isobel Brown, Interim Programme Director for the Midlands Engine.
Tea and coffee, and breakfast rolls, will be provided for delegates at the events.
For online booking to attend the remaining free D2N2 Business Breakfasts, go to the D2N2 website Events page at www.d2n2lep.org/Events . Alternatively contact D2N2 Social Media and Marketing Officer Sam Burbage on 0115 957 8254 or email: [email protected]
Read more about the events on Twitter at @D2N2LEP and follow the D2N2 Business Breakfasts hashtag #D2N2BB2017
Media wanting more information on the work of the D2N2 Local Enterprise Partnership can contact D2N2 Social Media and Marketing Officer on 0115 957 8254 or email: [email protected]